(本篇轉載自中國武漢理工大學學報)
蔡孟涵、莊世坤 國立臺灣大學氣候天氣災害研究中心
康仕仲 國立臺灣大學土木工程學系
康仕仲 國立臺灣大學土木工程學系
摘要
本研究目的在提供視覺化之防災資訊供決策使用。為有效保存災害資訊及促進未來預警/研判之能力,我們收集及匯整臺灣大學氣候天氣災害研究中心過去之專案經驗,並初步加以制定分類架構。除了專案基本資料外,亦包含氣象、水文、水理、土砂等相關資料。以這些資料為基礎,初步的創建一標準資料儲存機制D-Cloud,並確認其完整性。最後並初步以近三年來侵臺之颱風資料為範例,透過Tableau及ChronoZoom平台,以視覺化的方式呈現防災資訊典藏平台,期在未來能提供相同呈現規格及訊息,供氣象人員使用,也希望藉由此一致性及資料互通性,促進防災應變之效率及正確性。
关键词:防災資訊; 視覺化; 呈現; 典藏平台
Abstract
This research focuses on visualizing the disaster information for decision-making. To preserve disaster information and promotes future alert/determine ability, we collected and compiled project experiences of Center for Weather Climate and Disaster Research in the last years and established sorting framework initially. In addition to the basic information of the projects, we also included hydro-meteorological, flooding simulation, and sediment-related disaster model et al information. Using these data as the foundation, we established a standard data storage mechanism, the D-Cloud, and confirmed its integrity. Finally, we use the typhoons that stormed Taiwan in the recent three years as examples to test the implementation of visualization on presenting the disaster information archive platform through Tableau and ChronoZoom platform. We hope to provide same specifications and information for the weather personnel to use; we also hope that through the unification and coherence of the information, we could promote the efficiency and accuracy of the contingency plan.
Key words: disaster information; visualization; presentation, archive platform
Many disasters occurred in Taiwan annually in terms of types and quantity, causing tremendous loss and influence to the residence. Over years, many departments of the government invest significant efforts and resources on developing systems for disaster prevention, rescue and reduction. They create a large amount of the scientific research data; however, the construction and maintenance of the system will be complicated because of these data are not easy to use and also lack of portability. The fragment information retrieval procedures impede the use of information cross disciplinary and cross-department. This even influence in preserving disaster data and cause many redo works.
1 Introduction
Disaster information is an extremely valuable asset for a research team, society and even the whole mankind. It is collected through very expensive process, including a variety of sensors, long-distanced data transmission, and analysis by the professionals and experts with the background of weather, engineering and politics. This research aims to preserve the disaster information and leverage it usage.
2 Research Method
When establishing the data storage format, this research referred to the Open Archival Information System (OAIS)[1] (Figure 1) as announced in 2003 by the International Organization for Standardization (ISO) and The Big Data Supply Chain[2] (Figure 2) model to establish the Disaster Information Archive procedure (Figure 3).
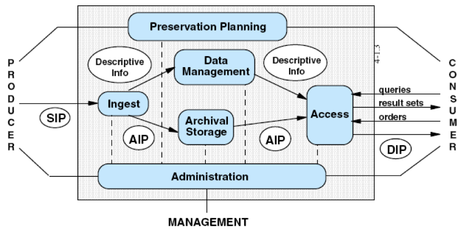
Figure 1 The Reference Model for an Open Archival Information System [1]
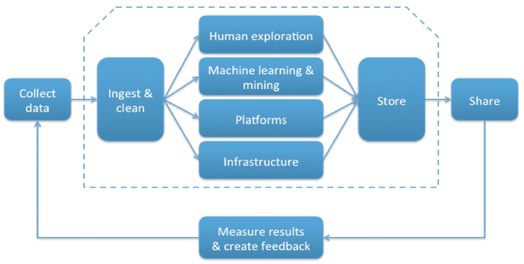
Figure 2 The Big Data Supply Chain [2]
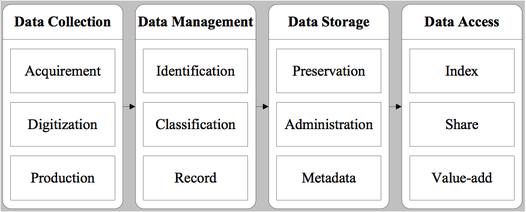
Figure 3 Flowchart of disaster information archive
The Disaster Information Archive preserves the spirit of digital archive, which are the usability, durability and smart integration. In this research, we expect to utilize the constant evolving data processing technology to preserve, process and collect information digitally and further adding value to the disaster information integration to create even bigger information value and application, achieving the goal of knowledge management and discovery.
In the following, this research will based on the process of disaster information archive to introduce the research outcomes of this year (2012).
In the following, this research will based on the process of disaster information archive to introduce the research outcomes of this year (2012).
3 Research Outcomes
3.1 Data Collection: Collect and organize hydro-meteorological, flooding simulation, and sediment-related disaster model datasets
Since established in 2003, Center for Weather Climate and Disaster Research (WCDR) has been receiving annually 8 to 10 collaborative research projects with industry, government or academia; it has its own standing in the field of disaster reduction and prevention. Since disaster prevention is a timely task, the information preservation becomes relevantly important. It is a huge task to effectively preserve each disaster contingency plan for the reference of future decision making. Take 2012 for example, till the end of September, 16 typhoons were formed near Taiwan which did not include the heavy rain caused by air current. In facing the increasing complexity of the climate, only by preserving the information could effectively provide reference for the use of next level.
There are three important missions in the category of data collection, they are: data ingestion, data digitization and data production. Currently we have collected 14 completed project information including historical disaster, weather & meteorology, water and hydrology, etc. These data will provide future value added, tradition, re-use through follow up management and storage, and to provide effective decision-making information support.
There are three important missions in the category of data collection, they are: data ingestion, data digitization and data production. Currently we have collected 14 completed project information including historical disaster, weather & meteorology, water and hydrology, etc. These data will provide future value added, tradition, re-use through follow up management and storage, and to provide effective decision-making information support.
3.2 Data Management: Create the standard format of data storage for disaster prevention
Data is categorized into the following 10 types after discussing with the project personnel for the effective use of the information: Tender Document, Service Suggestion, Evaluation Briefing, Contract, Preliminary and Midterm Report, Final Report, Result Report, Progress Report, Reference Information, and Others.
The data identification and classification for records in this category will benefit the follow up archive storage.
The data identification and classification for records in this category will benefit the follow up archive storage.
3.3 Data Storage: Design and create the data model of spatial database complying with standard format of data storage of D-Cloud
In this research, we proposed to designed and implemented NTU D-Cloud and D-Adapter. It is an intelligent framework to collect the research results from NTU teams. The major task is to automatically collect the data from different sources, mining the information hidden in the data, and finally present the information with a more standard way so that other people can reuse the information developed in the university.
Figure 4 shows the architecture of the smart platform. D-Cloud and D-Adapter are the two main components. D-Cloud can store and share data efficiently through cloud structure. D-Adapter provides an interface for transforming the results of the advanced research in NTU into standard format dynamically. During the process, the authority, usability, standard and sustainability of the data is considered. The NTU D-Cloud and D-Adapter consists the disaster reduction smart platform. Use D-Adapter to collect the results of this research. In addition, D-Cloud can provide the data for the society.
Figure 4 shows the architecture of the smart platform. D-Cloud and D-Adapter are the two main components. D-Cloud can store and share data efficiently through cloud structure. D-Adapter provides an interface for transforming the results of the advanced research in NTU into standard format dynamically. During the process, the authority, usability, standard and sustainability of the data is considered. The NTU D-Cloud and D-Adapter consists the disaster reduction smart platform. Use D-Adapter to collect the results of this research. In addition, D-Cloud can provide the data for the society.
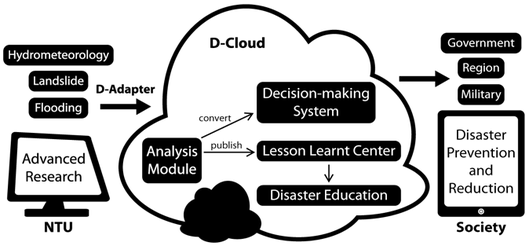
Figure 4 Architecture of the smart platform
3.4 Data Access: Implement and evaluate the designed data model for the purposes of disaster prevention
After planning the initial data collection, management and archive storage mechanism will be investigated. We picked major devastating typhoons in Taiwan between 2009 and 2012 as subjects to proceed with the initial exploration on the follow-up data application. Over ten interviews were conducted to survey the demand of the actual users and professionals on how to integrate the data into visualized display. This allowed the disaster contingency measure to be more intuitive, more efficient and accurate to assist in the decision making.
This year, we attempted to use Tableau which was based on breakthrough technology from Stanford University that allowed users to drag and drop when analyzing data. Simulation was conducted on archived historical disasters, weather, and hydrology to establish preliminary models on disaster weather (D-Weather) and disaster watch (D-Watch). The following is a brief introduction to the initial results of the two data base.
This year, we attempted to use Tableau which was based on breakthrough technology from Stanford University that allowed users to drag and drop when analyzing data. Simulation was conducted on archived historical disasters, weather, and hydrology to establish preliminary models on disaster weather (D-Weather) and disaster watch (D-Watch). The following is a brief introduction to the initial results of the two data base.
3.4.1 D-Weather
In addition to the WCDR information, this research also acquired historical typhoon data (Central Weather Bureau typhoon data base) of typhoons with warning issued from the Central Weather Bureau (CWB). Although CWB provided typhoon data list, information on typhoon such as path, wind speed, etc., required massive data comparison when conducting analysis for decision making. This research thus used six typhoons with warning issued during June 1st to August 30th in 2012 (Talim, Doksuri, Saola, Haikui, Kai-Tak, and Tembin) as examples to conduct visualized data exploration (Figure 5). based on the path, strength, pressure center and radius. User could set a specific time frame for comparison and could also click and highlight (Figure 6) the data to learn about the information of a particular time. We already established 20 pieces of data of typhoons from 2009 till now. This research expects to use this preliminary result to communicate and discuss with specialists and scholars to proceed with programming and interface editing and adjustment for the use in actual contingency plan.
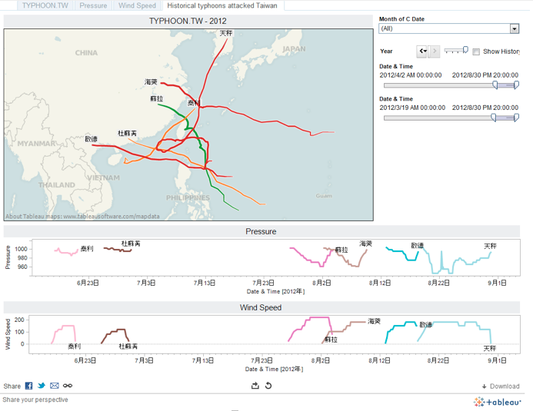
Figure 5 Taiwan Typhoon Data Base Overview
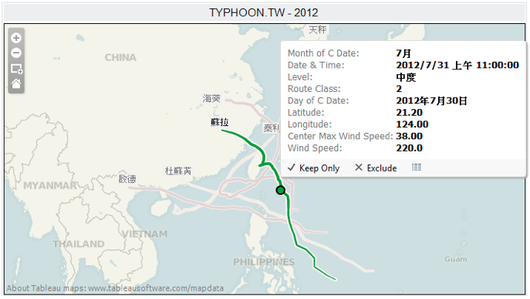
Figure 6 Information in specific time frame
In July, this research also communicated with Microsoft Research (MSR) and received authorization to use their research resources: ChronoZoom (http://www.chronozoomproject.org/). ChronoZoom is an open source community project dedicated to visualizing the history of everything to bridge the gap between humanities and sciences using the story of Big History to understand all this information easily.
After understanding the logic of the program data base, this research first established a historical imaging file (Figure 7) from year 2000 till now. We found that through the free enlarge and minimize on time and space through ChronoZoom, this historical data (Figure 8) could be presented in macroscopic or microcosmic way. Images or photo records at the time could also be obtained to effectively restore the situation at the time to assist in making better judgement on the decision making.
After understanding the logic of the program data base, this research first established a historical imaging file (Figure 7) from year 2000 till now. We found that through the free enlarge and minimize on time and space through ChronoZoom, this historical data (Figure 8) could be presented in macroscopic or microcosmic way. Images or photo records at the time could also be obtained to effectively restore the situation at the time to assist in making better judgement on the decision making.
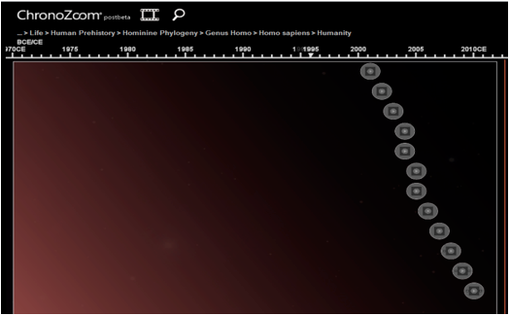
Figure 7 ChronoZoom overview
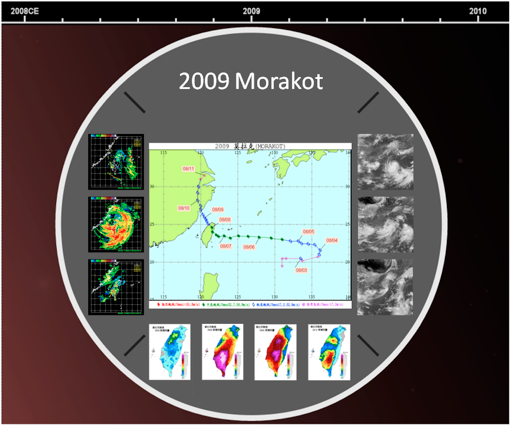
Figure 8 Showing Morakot Typhoon in ChronoZoom
3.4.2 D-Watch
Since 2008, WCDR would support the central units whenever typhoon or extremely heavy rain alert was issued. There are two main tasks of WCDR: 1) analysis based estimation: to provide overall evaluation and follow-up prediction extrapolated from the concurrent data for decision makers; 2) flood alert: to assess according to the precipitation observed and to notify authorities in charge regarding the river water line, flood, evacuation, and reservoir alert to be issued, or rescue team to be sent out.
In both tasks, massive volume of data and reports are needed for decision makers to make overall forecast and prediction. In general, it is not easy to make use of the information because most of the reports are in briefing format nowadays (Figure 9). This research used typhoon Talim and Doksuri as examples to establish a flood and reservoir alert database (Figure 10) by abstracting and format converting the briefing information into database. As a result, it is easier for decision makers to compile and analyze the information collected. With a click of a button, researchers can view detailed latest information on the screen with ease.
In both tasks, massive volume of data and reports are needed for decision makers to make overall forecast and prediction. In general, it is not easy to make use of the information because most of the reports are in briefing format nowadays (Figure 9). This research used typhoon Talim and Doksuri as examples to establish a flood and reservoir alert database (Figure 10) by abstracting and format converting the briefing information into database. As a result, it is easier for decision makers to compile and analyze the information collected. With a click of a button, researchers can view detailed latest information on the screen with ease.
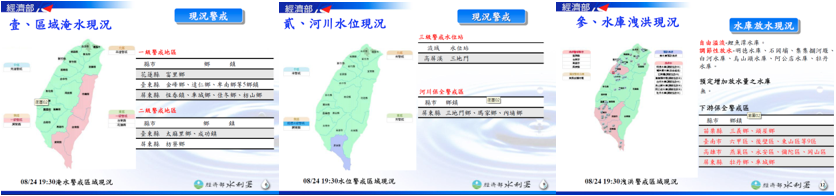
Figure 9 Real-time flood information
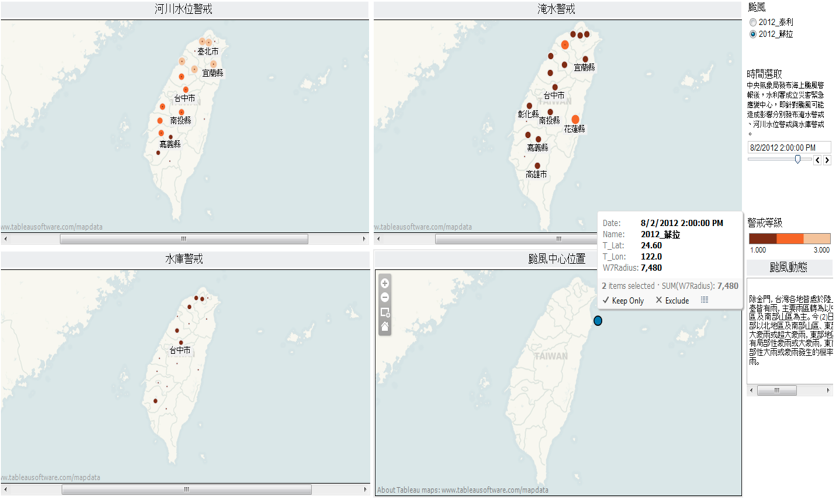
Figure 10 Interface prototype of the flood alert data base
4 Summary
Disaster information is comprised of complicated data from a variety of sources, both public and private. As a result, both disaster information collection and data analysis are difficult. The complexity of different disasters happening alongside one and another makes it extremely difficult to manage and store the data to a point of impossible to follow the procedures in some institutions. Experts from different backgrounds perceiving data from different perspectives might make it even more difficult for all experts to reach agreement when they are under the pressure to make real-time decisions.
This research is designed to house disaster information, response to disasters approximately, and make proper predictions in time. In the past seven months (April to October 2012), we collected and compiled reports made by the Disaster Center during the past six years and have collected 14 project information and established preliminary sorting framework. In addition to the basic information of the projects, we also included hydro-meteorological, flooding simulation, and sediment-related disaster model information. Using these data as the foundation, we established a standard data storage mechanism, the D-Cloud, and confirmed its integrity. Finally, we use the typhoons that stormed Taiwan in the recent three years as examples to test the implementation of visualization in presenting the disaster information archive platform with Tableau and ChronoZoom platforms. In the future, we hope to provide the same specs and information to meteorologists. In addition, we hope to raise the efficiency and accuracy of the contingency plan by unifying information. After developing the platform, we will further verify its workability and adaptability by testing the user experience.
This research is designed to house disaster information, response to disasters approximately, and make proper predictions in time. In the past seven months (April to October 2012), we collected and compiled reports made by the Disaster Center during the past six years and have collected 14 project information and established preliminary sorting framework. In addition to the basic information of the projects, we also included hydro-meteorological, flooding simulation, and sediment-related disaster model information. Using these data as the foundation, we established a standard data storage mechanism, the D-Cloud, and confirmed its integrity. Finally, we use the typhoons that stormed Taiwan in the recent three years as examples to test the implementation of visualization in presenting the disaster information archive platform with Tableau and ChronoZoom platforms. In the future, we hope to provide the same specs and information to meteorologists. In addition, we hope to raise the efficiency and accuracy of the contingency plan by unifying information. After developing the platform, we will further verify its workability and adaptability by testing the user experience.
References
[1] Reference model for an Open Archival Information System (OAIS); Consulative Committee for Space Data System: Washington, D.C, 2002; 4:1.
[2] Dumbill, E. (2012). Planning for Big Data, O'Reilly Media, Ebook, Safari Books Online.
[2] Dumbill, E. (2012). Planning for Big Data, O'Reilly Media, Ebook, Safari Books Online.

 RSS Feed
